To see accurate pricing, please choose your delivery country.
 
 
United States
£ GBP
All Shops

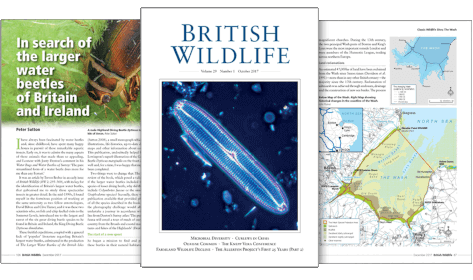
British Wildlife

8 issues per year 84 pages per issue Subscription only

British Wildlife is the leading natural history magazine in the UK, providing essential reading for both enthusiast and professional naturalists and wildlife conservationists. Published eight times a year, British Wildlife bridges the gap between popular writing and scientific literature through a combination of long-form articles, regular columns and reports, book reviews and letters.

Subscriptions from £33 per year

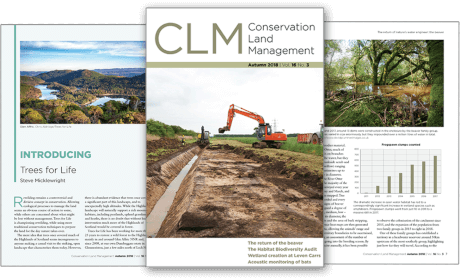
Conservation Land Management

4 issues per year 44 pages per issue Subscription only

Conservation Land Management (CLM) is a quarterly magazine that is widely regarded as essential reading for all who are involved in land management for nature conservation, across the British Isles. CLM includes long-form articles, events listings, publication reviews, new product information and updates, reports of conferences and letters.

Subscriptions from £26 per year
Academic & Professional Books  Reference  Data Analysis & Modelling  Data Analysis & Statistics

Interactive and Dynamic Graphics for Data Analysis With R and GGobi

Handbook / Manual
Series: Use R!
By: Dianne Cook and Deborah F Swayne
205 pages, 75 col illus
Publisher: Springer Nature
Interactive and Dynamic Graphics for Data Analysis
Click to have a closer look
  • Interactive and Dynamic Graphics for Data Analysis ISBN: 9780387717616 Paperback Dec 2007 Not in stock: Usually dispatched within 1-2 weeks
    £44.99
    #168715
Price: £44.99
About this book Customer reviews Related titles

About this book

This richly illustrated book describes the use of interactive and dynamic graphics as part of multidimensional data analysis. Chapters include clustering, supervised classification, and working with missing values. A variety of plots and interaction methods are used in each analysis, often starting with brushing linked low-dimensional views and working up to manual manipulation of tours of several variables. The role of graphical methods is shown at each step of the analysis, not only in the early exploratory phase, but in the later stages, too, when comparing and evaluating models.

All examples are based on freely available software: GGobi for interactive graphics and R for static graphics, modeling, and programming. The printed book is augmented by a wealth of material on the web, encouraging readers follow the examples themselves. The web site has all the data and code necessary to reproduce the analyses in the book, along with movies demonstrating the examples.

The book may be used as a text in a class on statistical graphics or exploratory data analysis, for example, or as a guide for the independent learner. Each chapter ends with a set of exercises.

Customer Reviews

Handbook / Manual
Series: Use R!
By: Dianne Cook and Deborah F Swayne
205 pages, 75 col illus
Publisher: Springer Nature
Current promotions
New and Forthcoming BooksNHBS Moth TrapBritish Wildlife MagazineBuyers Guides