To see accurate pricing, please choose your delivery country.
 
 
United States
£ GBP
All Shops

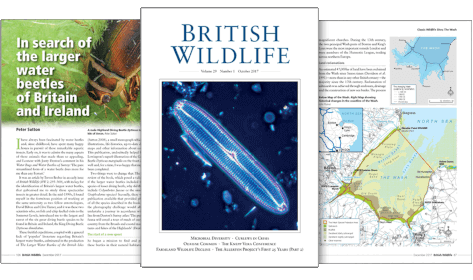
British Wildlife

8 issues per year 84 pages per issue Subscription only

British Wildlife is the leading natural history magazine in the UK, providing essential reading for both enthusiast and professional naturalists and wildlife conservationists. Published eight times a year, British Wildlife bridges the gap between popular writing and scientific literature through a combination of long-form articles, regular columns and reports, book reviews and letters.

Subscriptions from £33 per year

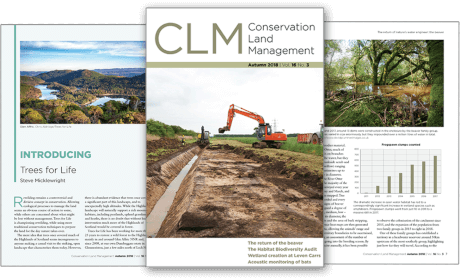
Conservation Land Management

4 issues per year 44 pages per issue Subscription only

Conservation Land Management (CLM) is a quarterly magazine that is widely regarded as essential reading for all who are involved in land management for nature conservation, across the British Isles. CLM includes long-form articles, events listings, publication reviews, new product information and updates, reports of conferences and letters.

Subscriptions from £26 per year
Academic & Professional Books  Reference  Data Analysis & Modelling  Data Analysis & Statistics

ggplot2: Elegant Graphics for Data Analysis

Handbook / Manual Out of Print
Series: Use R!
By: Hadley Wickham(Author)
212 pages, colour & b/w illustrations, tables
Publisher: Springer Nature
ggplot2: Elegant Graphics for Data Analysis
Click to have a closer look
  • ggplot2: Elegant Graphics for Data Analysis ISBN: 9780387981406 Paperback Aug 2009 Out of Print #201659
About this book Contents Biography Related titles

About this book

ggplot2: Elegant Graphics for Data Analysis will be useful to everyone who has struggled with displaying their data in an informative and attractive way. You will need some basic knowledge of R (i.e. you should be able to get your data into R), but ggplot2 is a mini-language specifically tailored for producing graphics, and you'll learn everything you need in ggplot2: Elegant Graphics for Data Analysis. After reading ggplot2: Elegant Graphics for Data Analysis you'll be able to produce graphics customized precisely for your problems, and you'll find it easy to get graphics out of your head and on to the screen or page.

Contents

- Preface
- Getting started with qplot
- Mastering the grammar
- Build a plot layer by layer
- Toolbox
- Scales, axes and legends
- Positioning
- Polishing your plots for publication
- Manipulating data
- Reducing duplication

Customer Reviews

Biography

Hadley Wickham is an Assistant Professor of Statistics at Rice University, and is interested in developing computational and cognitive tools for making data preparation, visualization, and analysis easier. He has developed 15 R packages and in 2006 he won the John Chambers Award for Statistical Computing for his work on the ggplot and reshape R packages.

Handbook / Manual Out of Print
Series: Use R!
By: Hadley Wickham(Author)
212 pages, colour & b/w illustrations, tables
Publisher: Springer Nature
Current promotions
New and Forthcoming BooksNHBS Moth TrapBritish Wildlife MagazineBuyers Guides