Call us (08:30-16:00 UK)
01803 865913International
+44 1803 865913Need Help?
Help pages
Important Notice for US Customers
Due to changes at US Customs we will be only processing the shipping of orders through UPS. The purchase cost does not include any costs incurred from US Customs and the receiver will be liable for all import duties and taxes associated with their order. Should the order be returned undelivered, please note the refund will be processed minus the shipping costs.
Certain goods from specific countries are subject to higher tariffs and import restrictions. Ensure you check the regulations regarding the country of origin of your items to avoid unexpected charges or delays. Also ensure you select "business address" or "home address" when adding a new address to ensure your order is reported correctly
If you have any questions or need help with placing your order, please contact our Customer Services Team or select "Quotation" as the payment method online. Furthermore you can contact your local customs office for further information.
Wildlife Survey & Monitoring
- Aquatic Survey & Monitoring
- Professional Hand & Kick Nets
- Water Testing
- Waders & Aquatic Safety
- View All
- Amphibian & Reptile Survey
- Amphibian Survey & Monitoring
- Reptile Survey & Monitoring
- Scales, Balances & Holding Bags
- View All
Field Guides & Natural History
Academic & Professional Books
- Evolutionary Biology
- Evolution
- Human Evolution & Anthropology
- Cladistics, Phylogeny & Taxonomy
- View All
British Wildlife
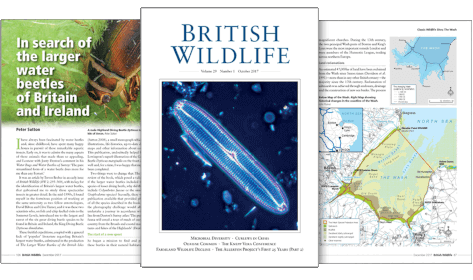
British Wildlife is the leading natural history magazine in the UK, providing essential reading for both enthusiast and professional naturalists and wildlife conservationists. Published eight times a year, British Wildlife bridges the gap between popular writing and scientific literature through a combination of long-form articles, regular columns and reports, book reviews and letters.
Conservation Land Management
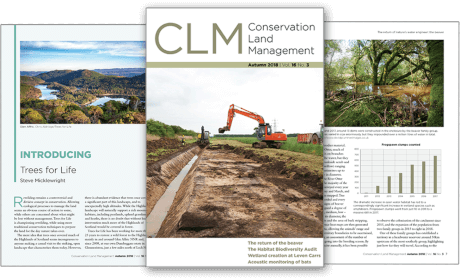
Conservation Land Management (CLM) is a quarterly magazine that is widely regarded as essential reading for all who are involved in land management for nature conservation, across the British Isles. CLM includes long-form articles, events listings, publication reviews, new product information and updates, reports of conferences and letters.